Determining a company’s worth demands more than basic arithmetic. Accurate valuations blend financial metrics, market trends, and strategic positioning to reflect true commercial potential. This process not only aids sellers in setting realistic expectations but also equips buyers with critical insights for informed decisions.
Profitability remains the cornerstone of any valuation. Buyers typically assess earnings history and growth projections before considering offers. Sellers must therefore prioritise transparent financial records and demonstrable revenue streams to justify their asking figures.
Market conditions significantly influence outcomes. Industries with high demand often command premium prices, while sectors facing challenges may require adjusted approaches. External factors like economic stability or regulatory changes also play pivotal roles in shaping valuations.
Beyond numbers, intangible assets such as brand reputation or customer loyalty contribute to perceived value. These elements, though harder to quantify, can differentiate organisations in competitive markets. Strategic preparation highlighting these strengths often leads to favourable negotiations.
This guide explores proven methodologies to balance these components effectively. From earnings multiples to asset-based appraisals, we’ll clarify which techniques suit specific scenarios. Practical advice will help owners present their ventures as compelling opportunities, maximising returns during sales processes.
Understanding Business Valuation Fundamentals
Valuing an enterprise requires a blend of analytical precision and market insight. Foundational principles guide this process, ensuring both buyers and sellers operate with clarity. Let’s explore the core elements that shape commercial appraisals.
Key Concepts in Valuing a Business
Business valuation hinges on three pillars: earnings metrics, asset evaluations, and market dynamics. Distinguishing between profit types – such as net income versus discretionary earnings – is critical. Asset classifications (tangible vs intangible) further refine assessments.
Market forces like industry demand or economic shifts also sway outcomes. A tech startup might command higher multiples than a traditional retail shop, for instance. Recognising these variables helps stakeholders contextualise numerical data.
Defining Seller’s Discretionary Earnings (SDE)
SDE measures the total annual financial benefit for a sole owner-operator. This metric combines:
- Reported net income
- Owner’s salary and benefits
- Non-essential expenses (travel, vehicles)
“SDE cuts through accounting formalities to reveal true owner compensation potential.”
For small enterprises, this approach clarifies actual cash flow. Consider this comparison:
| SDE Component | Typical Adjustment | Impact on Valuation |
|---|---|---|
| Owner salary | Added back | Increases earnings base |
| Personal expenses | Removed | Reflects commercial reality |
| One-time costs | Excluded | Normalises performance |
Unlike EBITDA, SDE accounts for owner-specific financial patterns. This makes it ideal for businesses where personal and commercial finances often intertwine. Understanding these discretionary earnings principles ensures valuations align with real-world operations.
Essential Financial Metrics: Cash Flow, SDE and EBITDA
Financial clarity separates successful valuations from speculative guesses. Three metrics dominate commercial appraisals: cash flow, Seller’s Discretionary Earnings (SDE), and Earnings Before Interest, Taxes, Depreciation, and Amortisation (EBITDA). Each serves distinct purposes depending on enterprise size and buyer type.
Comparing SDE and EBITDA for Small Businesses
SDE reflects total earnings available to owner-operators. It adds back personal expenses and salaries to net profit. For example:
- Net profit: £1,000,000
- Owner’s salary: £200,000
- SDE calculation: £1,000,000 + £200,000 = £1,200,000
EBITDA removes management costs to show operational efficiency. Using the same figures:
- Net profit: £1,000,000
- Management salary deduction: £200,000
- EBITDA result: £1,000,000 – £200,000 = £800,000
This fundamental difference dictates usage scenarios:
| Metric | Preferred By | Rationale |
|---|---|---|
| SDE | Individual buyers | Assumes owner-operation without management costs |
| EBITDA | Corporate buyers | Requires professional management replacements |
Cash flow analysis remains pivotal for both methods. Small enterprises benefit from SDE’s holistic view of discretionary earnings, while EBITDA standardises comparisons across larger organisations. Choosing the right metric aligns valuations with buyer expectations and industry norms.
Practical How-To: how to price a business for sale
Establishing a company’s market value requires structured analysis rather than guesswork. This approach combines financial rigour with strategic positioning to produce credible figures that withstand buyer scrutiny.
Three-Stage Earnings Analysis
Stage one focuses on calculating Seller’s Discretionary Earnings. Start with pre-tax earnings, then add back:
- Owner compensation packages
- Non-essential operational costs
- One-time expenditure anomalies
This creates an adjusted earnings figure reflecting actual commercial performance. For instance, a £200,000 salary and £50,000 in personal expenses would increase base profits by £250,000.
Multiplier Selection Strategy
Industry benchmarks dictate appropriate multipliers. Service firms often use 2-3x SDE, while tech ventures might command 4x. Consider:
- Client concentration risks
- Asset liquidity
- Market growth projections
These factors justify premium multiples or necessitate discounts. Documentation of adjustments proves crucial during negotiations.
The final calculation follows a straightforward formula: Value = SDE × Multiplier. A £300,000 SDE with 2.5x multiplier yields £750,000. This method balances mathematical precision with commercial reality, creating defensible asking prices aligned with cash flow potential.
Evaluating Assets, Liabilities and Intangible Value
Commercial worth extends beyond physical holdings. A thorough appraisal balances measurable resources against abstract advantages, creating a holistic view of enterprise potential. This process requires clear differentiation between transferable assets and obligations influencing net value.
Assessing Tangible versus Intangible Assets
Tangible assets form the backbone of operational capacity. These include property, machinery, stock, and liquid funds. While essential, their value typically diminishes over time due to wear or market shifts. Professional appraisals determine current fair market prices, especially for specialised equipment or commercial real estate.
Intangible assets increasingly drive premium valuations in modern markets. Patents, customer loyalty programmes, and proprietary software often represent untapped potential. Unlike physical resources, these elements appreciate through strategic use. For example, a trademarked brand identity could justify higher multiples when integrated into a strategic valuation framework.
Liability analysis completes the financial picture. Outstanding loans, pending legal disputes, or unearned revenue reduce net worth. Buyers scrutinise these obligations to assess risk exposure and negotiate adjustments. Transparent documentation of both assets and liabilities builds trust during sales discussions.
Successful evaluations separate owner-retained assets from those transferring with ownership. This clarity prevents disputes and ensures accurate value representation. Companies with robust intangible portfolios often leverage them to offset liability impacts, maximising appeal in competitive sectors.
Valuation Methods: Income, Market and Asset Approaches
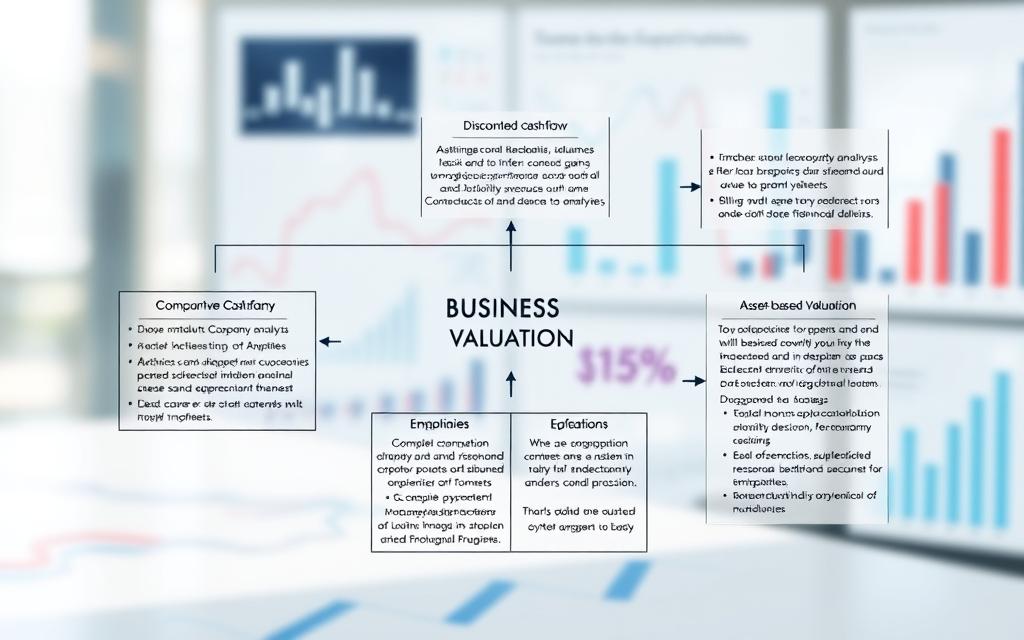
Three core methodologies shape modern business valuations. Each approach offers unique advantages depending on enterprise characteristics and transaction goals. Combining these techniques often yields the most balanced perspective.
Understanding the Income Approach and Discounted Cash Flow
The income-based method prioritises future earning potential. Professionals typically use discounted cash flow analysis to account for risk and time value. This involves:
- Projecting 5-10 years of cash flows
- Applying industry-specific discount rates
- Calculating terminal value for post-projection periods
Capitalisation of earnings suits stable companies with predictable growth. Both income-focused methods require accurate financial forecasts and market risk assessments.
Applying the Market-Based Valuation Method
This approach compares similar business sales using revenue or EBITDA multiples. Challenges arise from limited transaction transparency in private markets. Effective implementation demands:
- Access to verified industry databases
- Adjustments for size and operational differences
- Analysis of current economic conditions
While useful for benchmarking, market comparisons often serve as secondary validation rather than primary valuation tools.
Asset-Driven Valuation: Adjusted Net Asset Method
This method calculates net worth by subtracting liabilities from adjusted asset values. It’s particularly relevant for:
| Asset Type | Valuation Consideration |
|---|---|
| Property | Current market appraisals |
| Equipment | Depreciation schedules |
| Intangibles | Brand recognition audits |
Liquidation scenarios frequently employ this approach, though it may undervalue operational synergies in going concerns.
Industry Research, Comparable Sales and Multiples
Industry benchmarks and past transaction data form the bedrock of credible valuations. Analysing sector-specific trends helps stakeholders align expectations with commercial realities. This approach bridges financial metrics with real-world market behaviour.
Using Comparable Sales to Inform Your Valuation
Private transaction data remains challenging to access. Business brokers and M&A specialists often hold exclusive insights through proprietary databases. Their reports reveal patterns in earnings multiples across similar companies.
Current market standards for enterprises under $5 million revenue show clear variations:
- Retail/service/food: 1.5-3.0x SDE
- Manufacturing: 3.0-5.0x+ SDE
- Wholesale: 2.0-4.0x SDE
Mid-sized organisations typically command 3-6x EBITDA multiples. These figures reflect buyer perceptions of risk versus growth potential. Small businesses prioritise SDE adjustments to account for owner-operators’ roles.
Effective research combines industry-specific data with expert interpretation. This dual focus creates valuations that withstand scrutiny while capturing intangible assets. Savvy buyers and sellers leverage these insights to negotiate from informed positions.


